Read this report alongside the linked primary sources. Distinguish the announced event from its potential effect on your business.
Three views of a changing Pacific
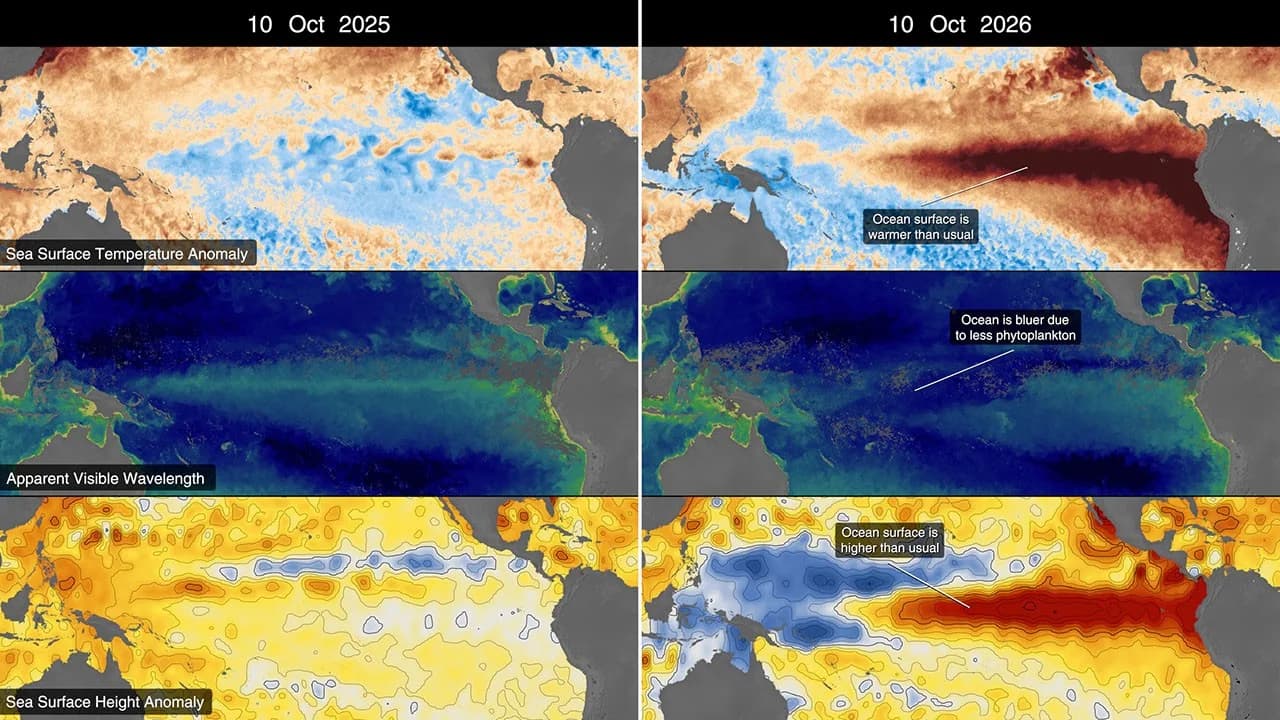
NASA’s October 15 report on El Niño compares sea-surface temperature, sea-surface height and ocean-color observations. Together, those measurements show different aspects of a changing Pacific rather than interchangeable pictures of the same quantity. The report describes the exceptional development of the current event, while the maps retain their own dates, units and reference periods. A reader should inspect those labels before interpreting a red or blue area. Satellite evidence can reveal a broad climate pattern, but it does not tell a business the precise rainfall, flood depth or travel conditions at a particular address on a particular future day.
Read an anomaly map with its baseline
An anomaly describes a difference from a specified baseline. It is not necessarily the absolute temperature or sea level at the location. Compare like-for-like maps with the same variable, units and period before drawing a trend. Notice where data are missing and whether the image is a single observation, an average or a visualization assembled from several products. These distinctions help a reader use the graphic as evidence instead of treating its colors as a complete forecast. They also make it easier to explain why a striking ocean image may require additional local information before it can support an operating decision.
Turn climate context into a local preparedness question
A business can use the broader pattern to review exposure without assuming a specific storm outcome. Identify suppliers, routes, outdoor activities and properties that are sensitive to prolonged rain, heat or interrupted access. Link each exposure to the official local forecast or warning service that would trigger action. Record who checks those updates and how customers are informed if plans change. Keep seasonal context separate from an immediate warning, because they operate on different timescales. The next useful evidence is the combination of later ocean observations and location-specific forecasts, with decisions tied to the information relevant to the actual people, property and commitments involved.
Image source and usage
NASA visualization comparing Pacific Ocean conditions associated with El Niño
NASA Scientific Visualization Studio
Source image · Image-use terms
Web versions are resized and compressed; attribution and applicable source terms are retained.
Frequently asked questions
Does an El Niño map predict the weather at my address?
No. It describes a large-scale ocean and climate pattern. Use official local forecasts and warnings for immediate decisions.
Sources & further reading
Source links checked October 19, 2026. Rules and availability may change; verify current terms directly. Read our editorial standards.